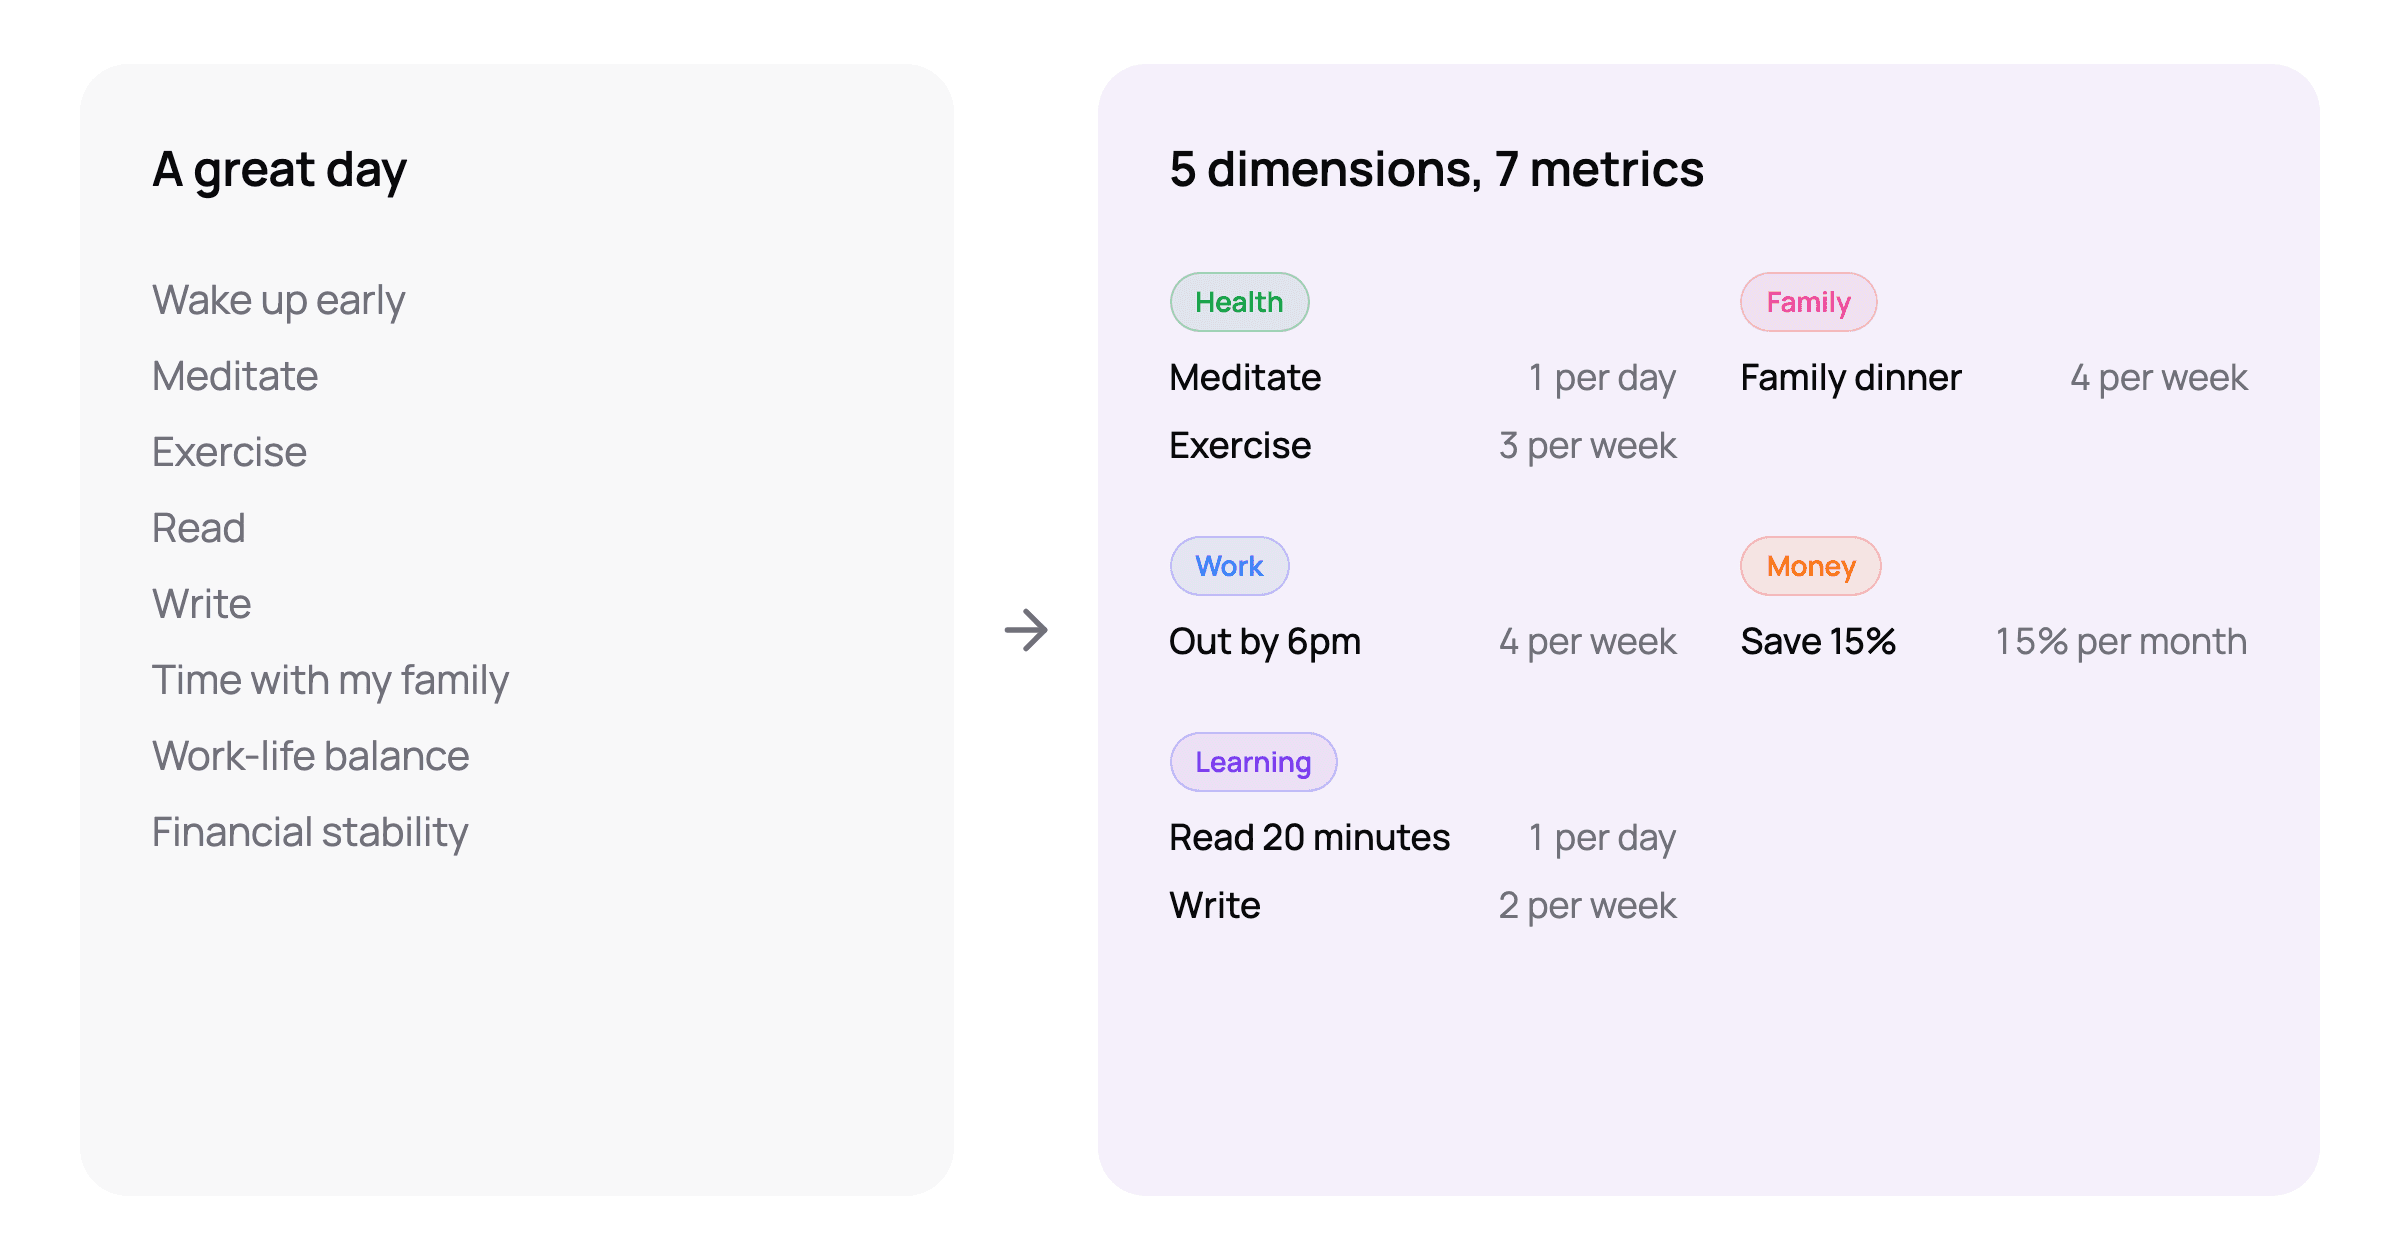
In the last post I went from a picture of a good day to seven metrics across five areas of life. This one is about the step most lists skip: not how many metrics to track, but which ones. Because for about a year I tracked 30, and the problem wasn't only the number. Some of those metrics were helping me live the life I'd described, and some were quietly doing the opposite, and from the inside of the spreadsheet they looked exactly the same.
A metric helps when it tells you something you'd act on. It hurts when logging it costs more than knowing it, or when the number starts standing in for the thing it was meant to measure. Here is how I tell them apart now, with examples from my own list.
What a life metric is for
A metric isn't a goal and it isn't a rule. It's a question you ask yourself at the same time every day, week or month, with an answer short enough to write down: did I meditate? how many nights did I sleep seven hours? did I leave work on time?
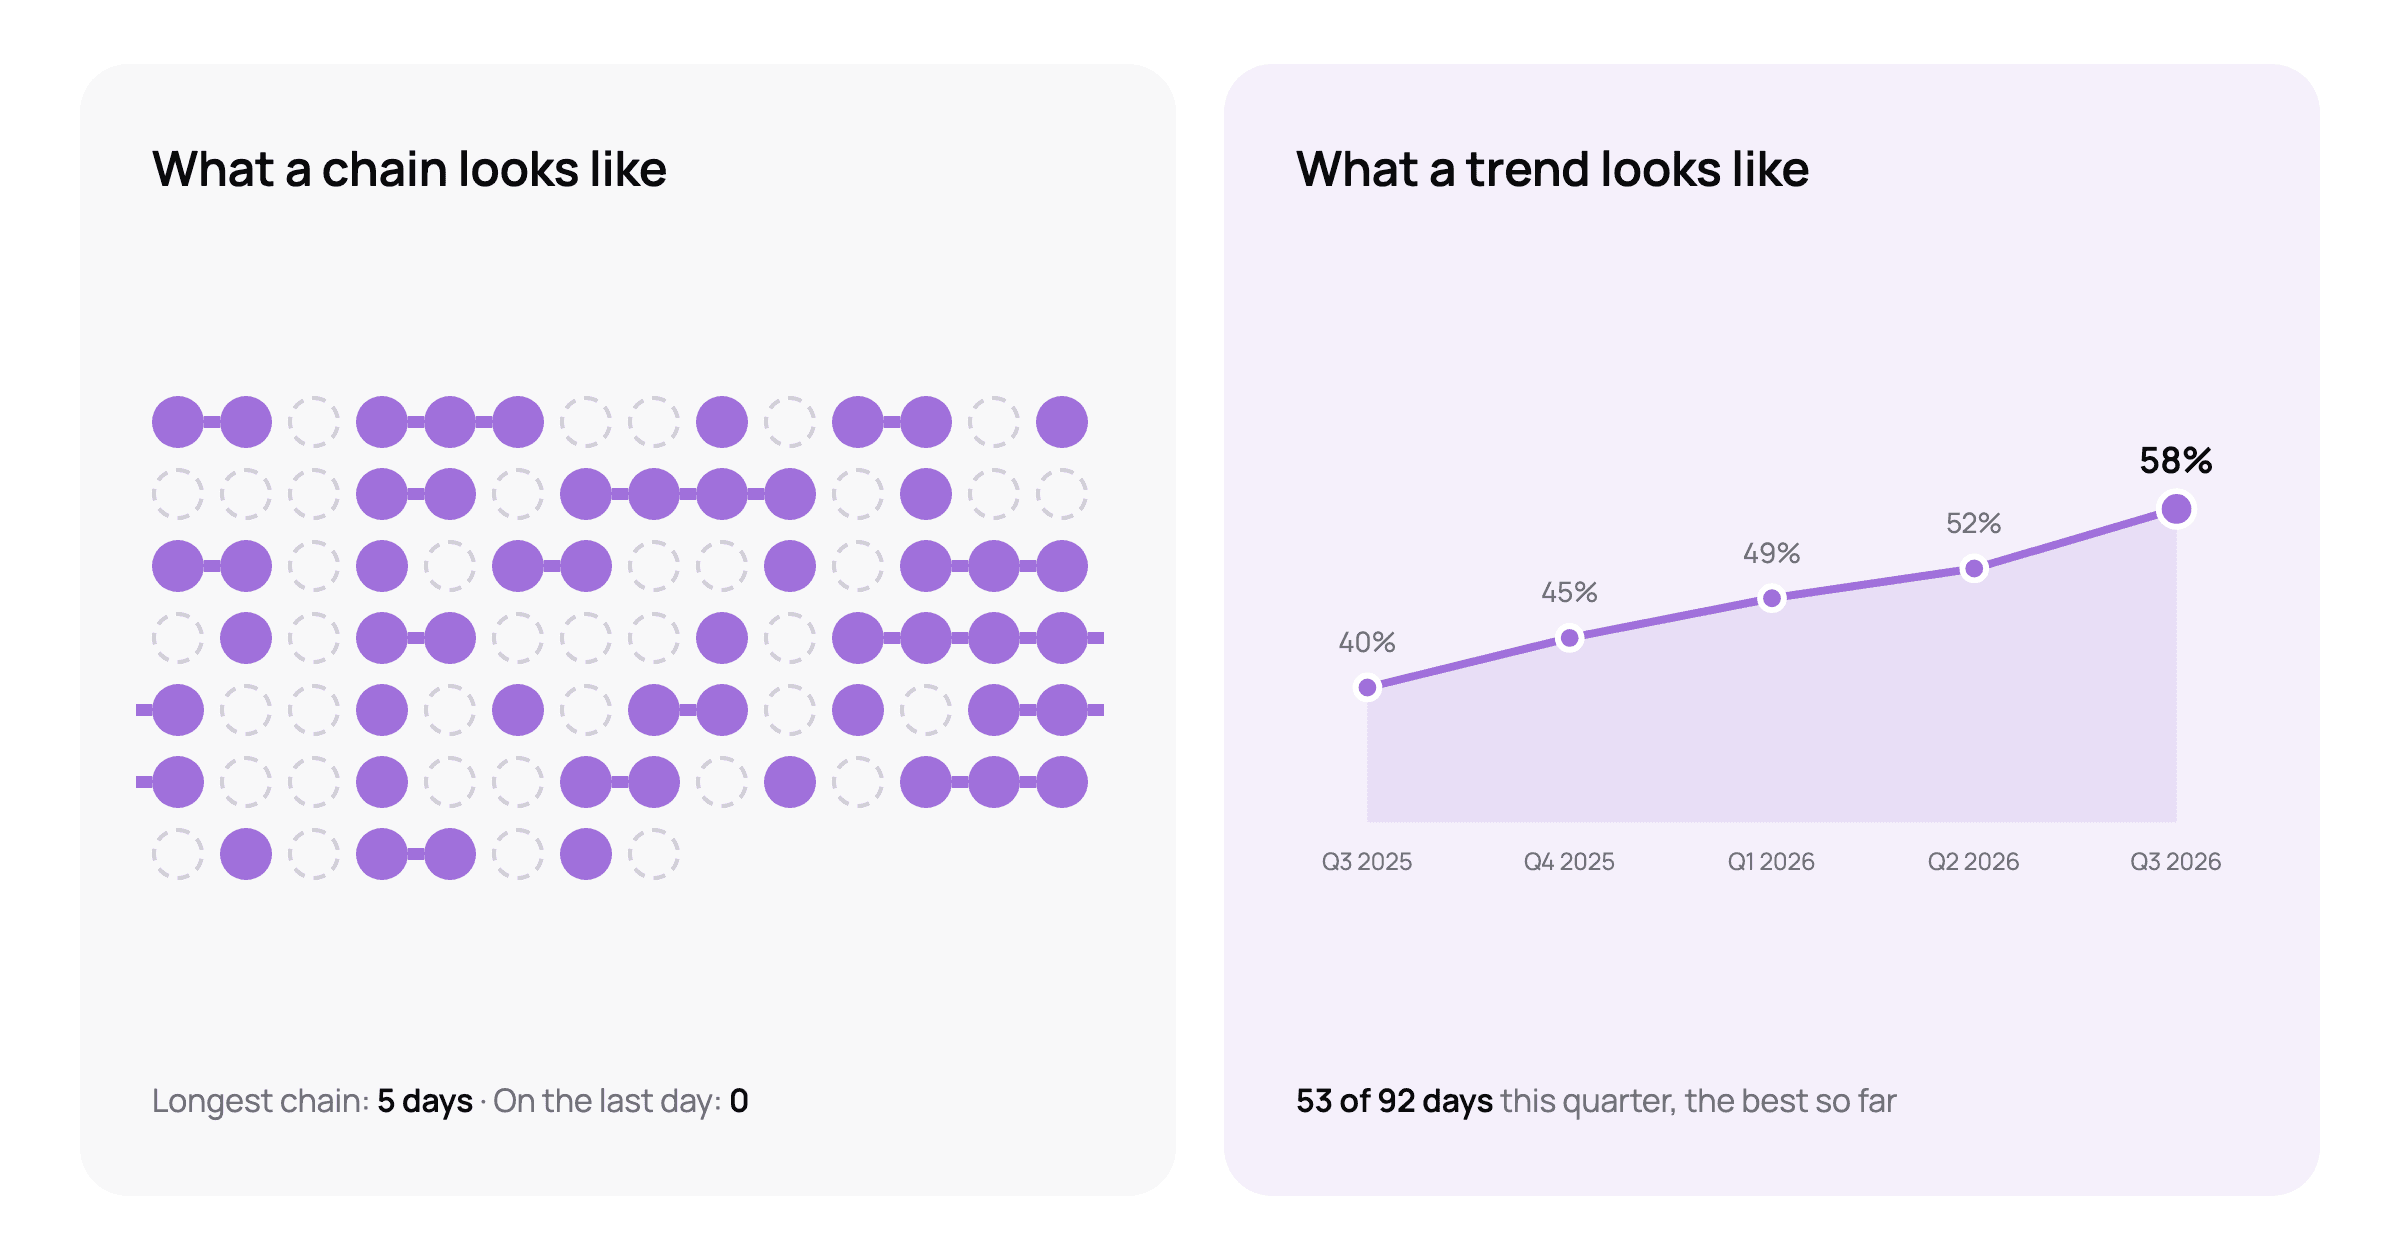
The point of asking is the answer three months later. On its own, "4 of 7 days" means little. Next to the quarter before, it becomes a direction: better, the same, or slipping. That comparison is the entire return on logging. If a metric can't produce it, because the answer is always yes, or the number means something different every month, or you stopped logging it in week three, it isn't paying for itself.
I wrote the rules I use for picking one in the last post: in your control, observable, seconds to log, with a target an ordinary week can hit and a frequency that fits the thing. Those rules describe a metric that can help. Whether it does only shows up after you've lived with it for a while, and that's where the examples come in.
Metrics that helped me
These are from my own list, and here is what they have in common.
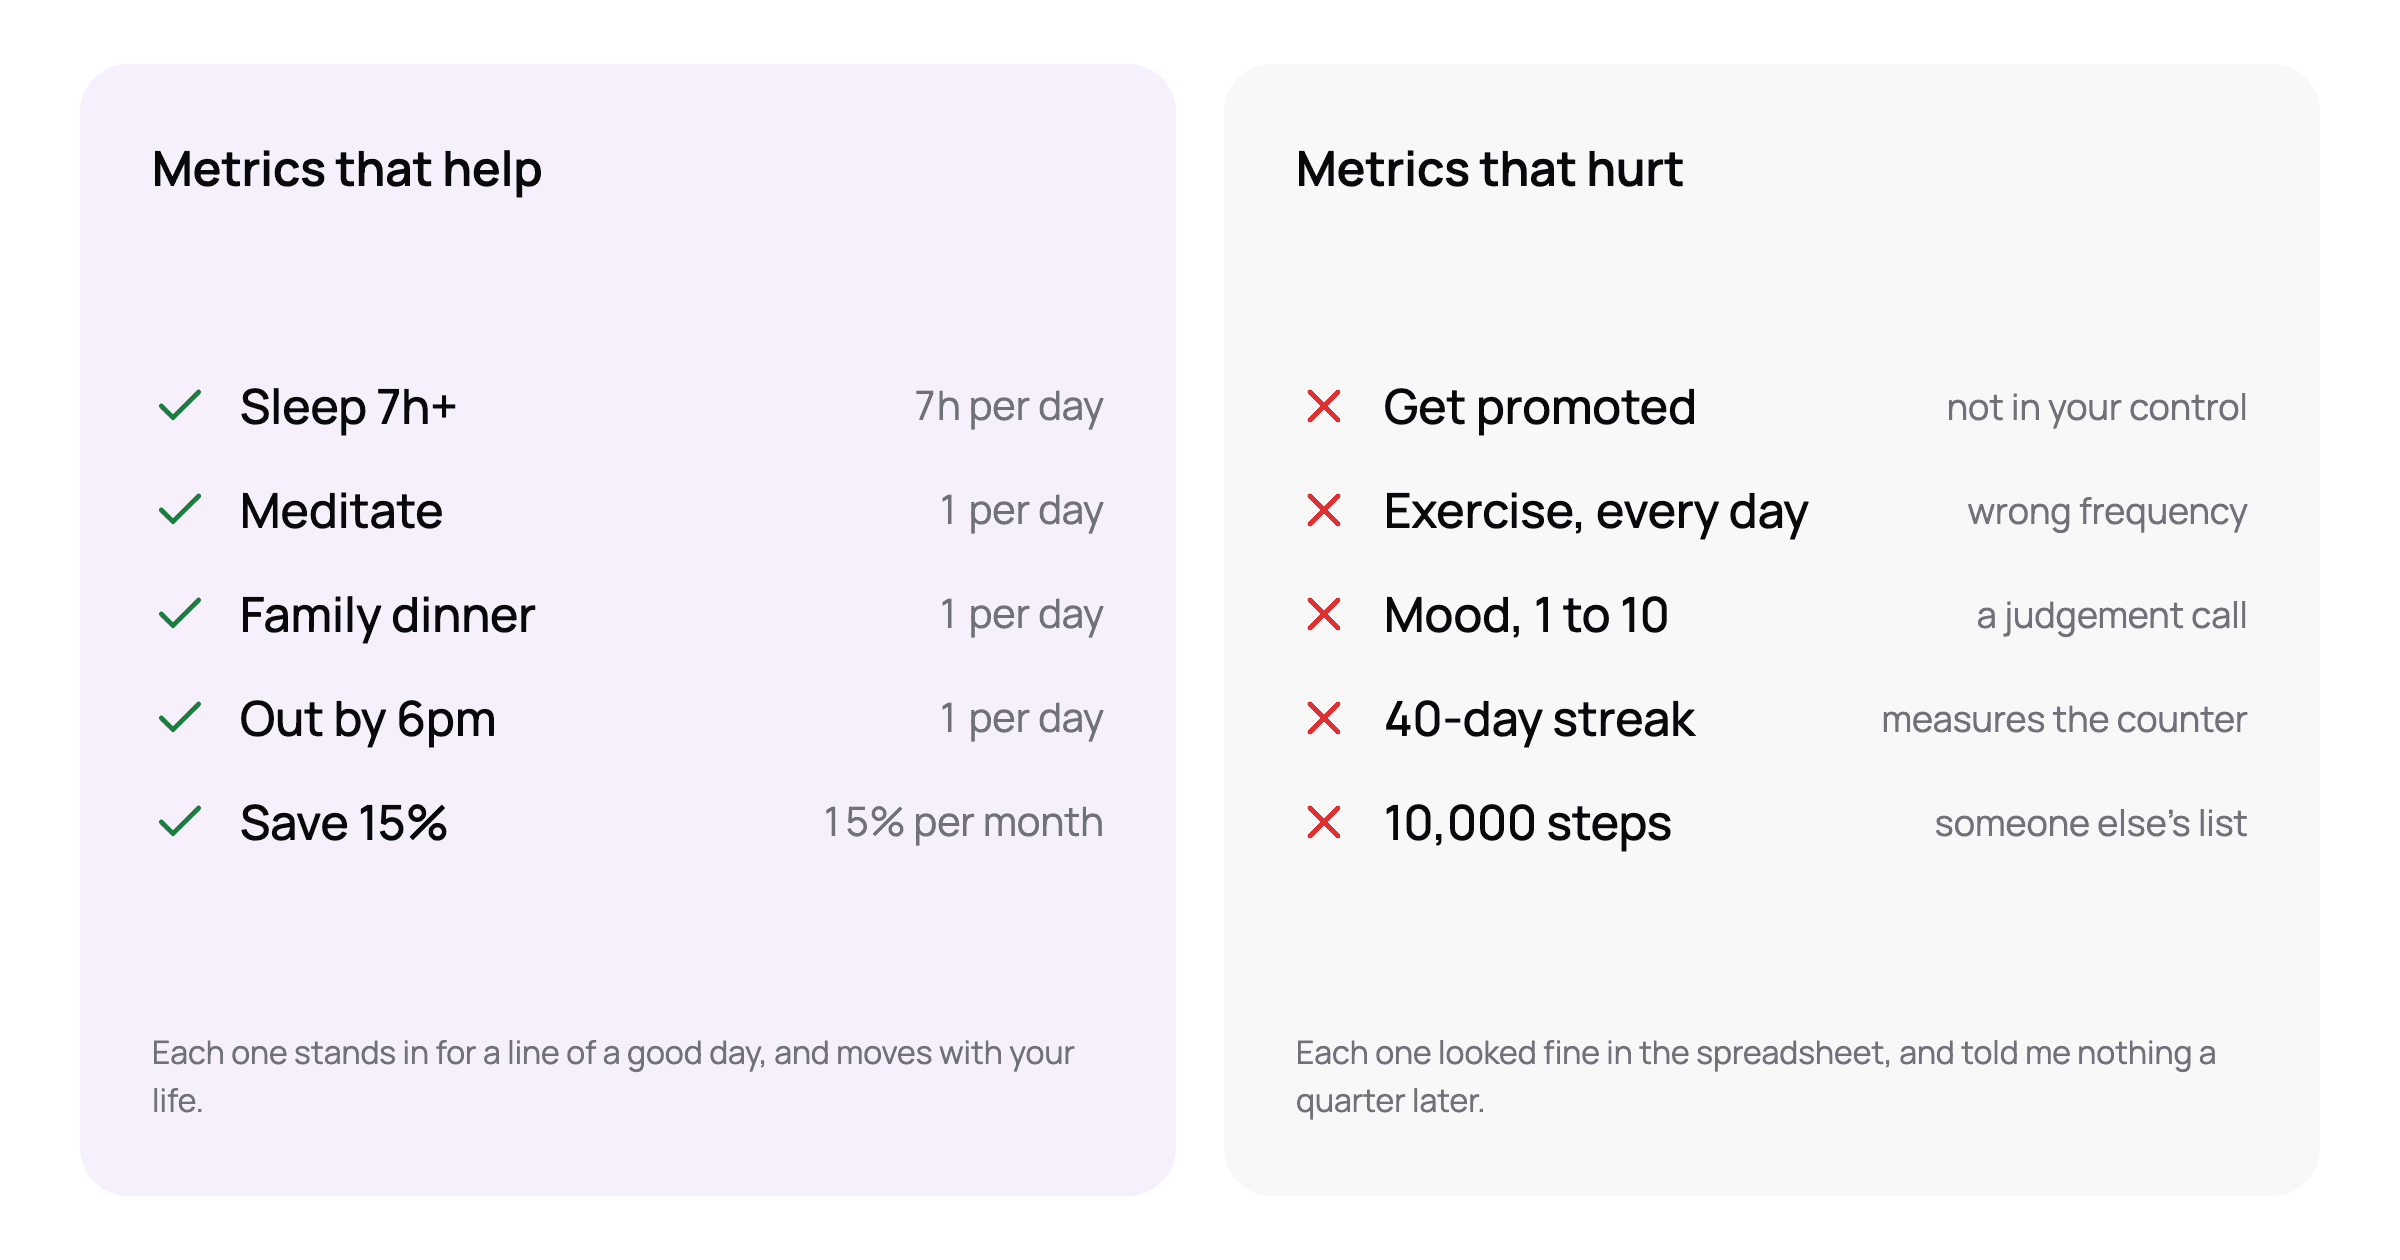
Nights with seven hours of sleep. Sleep syncs in from Withings, so logging it costs nothing, and the number has explained more of my quarters than any other metric. When it dropped this summer, the World Cup was on and the matches finished late; when it dropped for months after our baby was born, well, that was the baby. A metric that explains the others is worth more than one that only describes itself.
Meditate, as a rate. Last quarter I meditated on 58% of days. As a streak, that quarter was unimpressive: gaps everywhere, no long run. As a rate against the quarter before, it was my best so far. The metric helped only once I stopped counting consecutive days, and I wrote the long version of that in why habit streaks backfire.
Family dinner. "Time with my family" is what I wanted, and it's impossible to log honestly. A dinner together is a yes or a no, it's the part of the day I most wanted to protect, and it was the first thing to go when work got busy. The metric caught that before I would have.
Out by 6pm. Same shape: "work-life balance" became one observable thing. Four days a week in an ordinary quarter, three in a busy one, and the target moves with the quarter. It's a metric about a choice I make every afternoon, which is exactly where a metric belongs.
Save 15%, once a month. One number when the month's bills are in, not a budget with forty categories. Monthly is the frequency that keeps it honest: a daily savings metric would be noise, and a yearly one wouldn't tell me anything until it was too late to change.
What they share: each one stands in for a line of my ideal life vision, each takes seconds to answer, and each has moved with my life in a way I could read. None of them were on anyone else's list.
Metrics that hurt
These are the shapes that have cost me, and that I'd recognise in anyone's list.
The one you can't control
"Get promoted", "lose five kilos", "hit the savings goal by June". These are fine things to want and bad things to log, because the day-to-day answer is "not yet" for months and then "yes" once. A metric is for the things you do, not the things that happen to you. If a goal matters, find the behaviour under it that you control, and track that: the workouts, the savings rate, the hours of deep work. The goal takes care of itself, or it doesn't, and either way the metric told you something.
The one with the wrong frequency
Exercise, every day. Every rest day is a miss, the rate drops to numbers that make no sense, and after a month the metric says you're failing at something you're doing three times a week. The same metric at three a week is one of the most useful I have. Most "I can't keep up with it" problems are frequency problems.
The one that needs a judgement call
My Google Sheet had a mood column, 1 to 10. The trouble with a 7 is that March's 7 and September's 7 aren't the same 7, and the evening I'm logging it I'm grading the evening, not the day. Anything that asks "how good was today?" drifts with how you feel at logging time, and a number that drifts can't be compared with the quarter before, which is the only reason to log it.
A metric has to measure something objective: a count, an amount, a yes or a no that two people watching your day would agree on. Hours slept, dinners at home, money saved. The moment the answer depends on your judgement, it's an opinion with a number on it, and opinions don't trend. If what you want to know is whether you're doing well, track the things that make a good day, and let the good days show up as a trend. If you want a mood metric anyway, make it observable: did I laugh today beats rate your mood.
The one that only measures the counter
A streak counter says 40-something, then zero, and nothing in between. It measures consecutive days, which isn't a thing your life runs on, and over time it teaches you to protect the counter rather than do the thing. I wrote the long version in why habit streaks backfire; the short version is that any metric whose number can be ruined by one ordinary Tuesday is measuring the wrong thing.
The one you borrowed
"Seven metrics every intentional person should track." I nearly wrote that post, and I'm glad I didn't, because I don't think it exists. Steps, water, pages, hours slept, minutes meditated: it's a reasonable list, and it's someone else's picture of a good day. A borrowed metric is easy to start, hard to keep, and tells you how far you are from a life you didn't choose. The only list that works is the one you built from your own picture of a good day. Mine has no steps and no water, and that's fine. Yours might have both and no meditation, and that's fine too.
The one that doubles another
"Wake up early" was in my vision and was never on my list, because if I'd meditated and exercised I'd woken up early enough. Two metrics for one behaviour means one of them is a tax: an extra thing to log, an extra way to miss, and no extra information. When two metrics always move together, keep the one that's easier to answer.
Too many of them
This one isn't a shape, it's a quantity, and it turns every good metric into a bad one. At 30 metrics, logging took longer than living some days, and every evening there was something I hadn't done. The metrics didn't change. The experience of looking at them did. Seven is plenty, no more than two per area is a good rule, and a short list you log every day beats a long list you log in bursts.
Personal metrics examples: what to track, by area of life
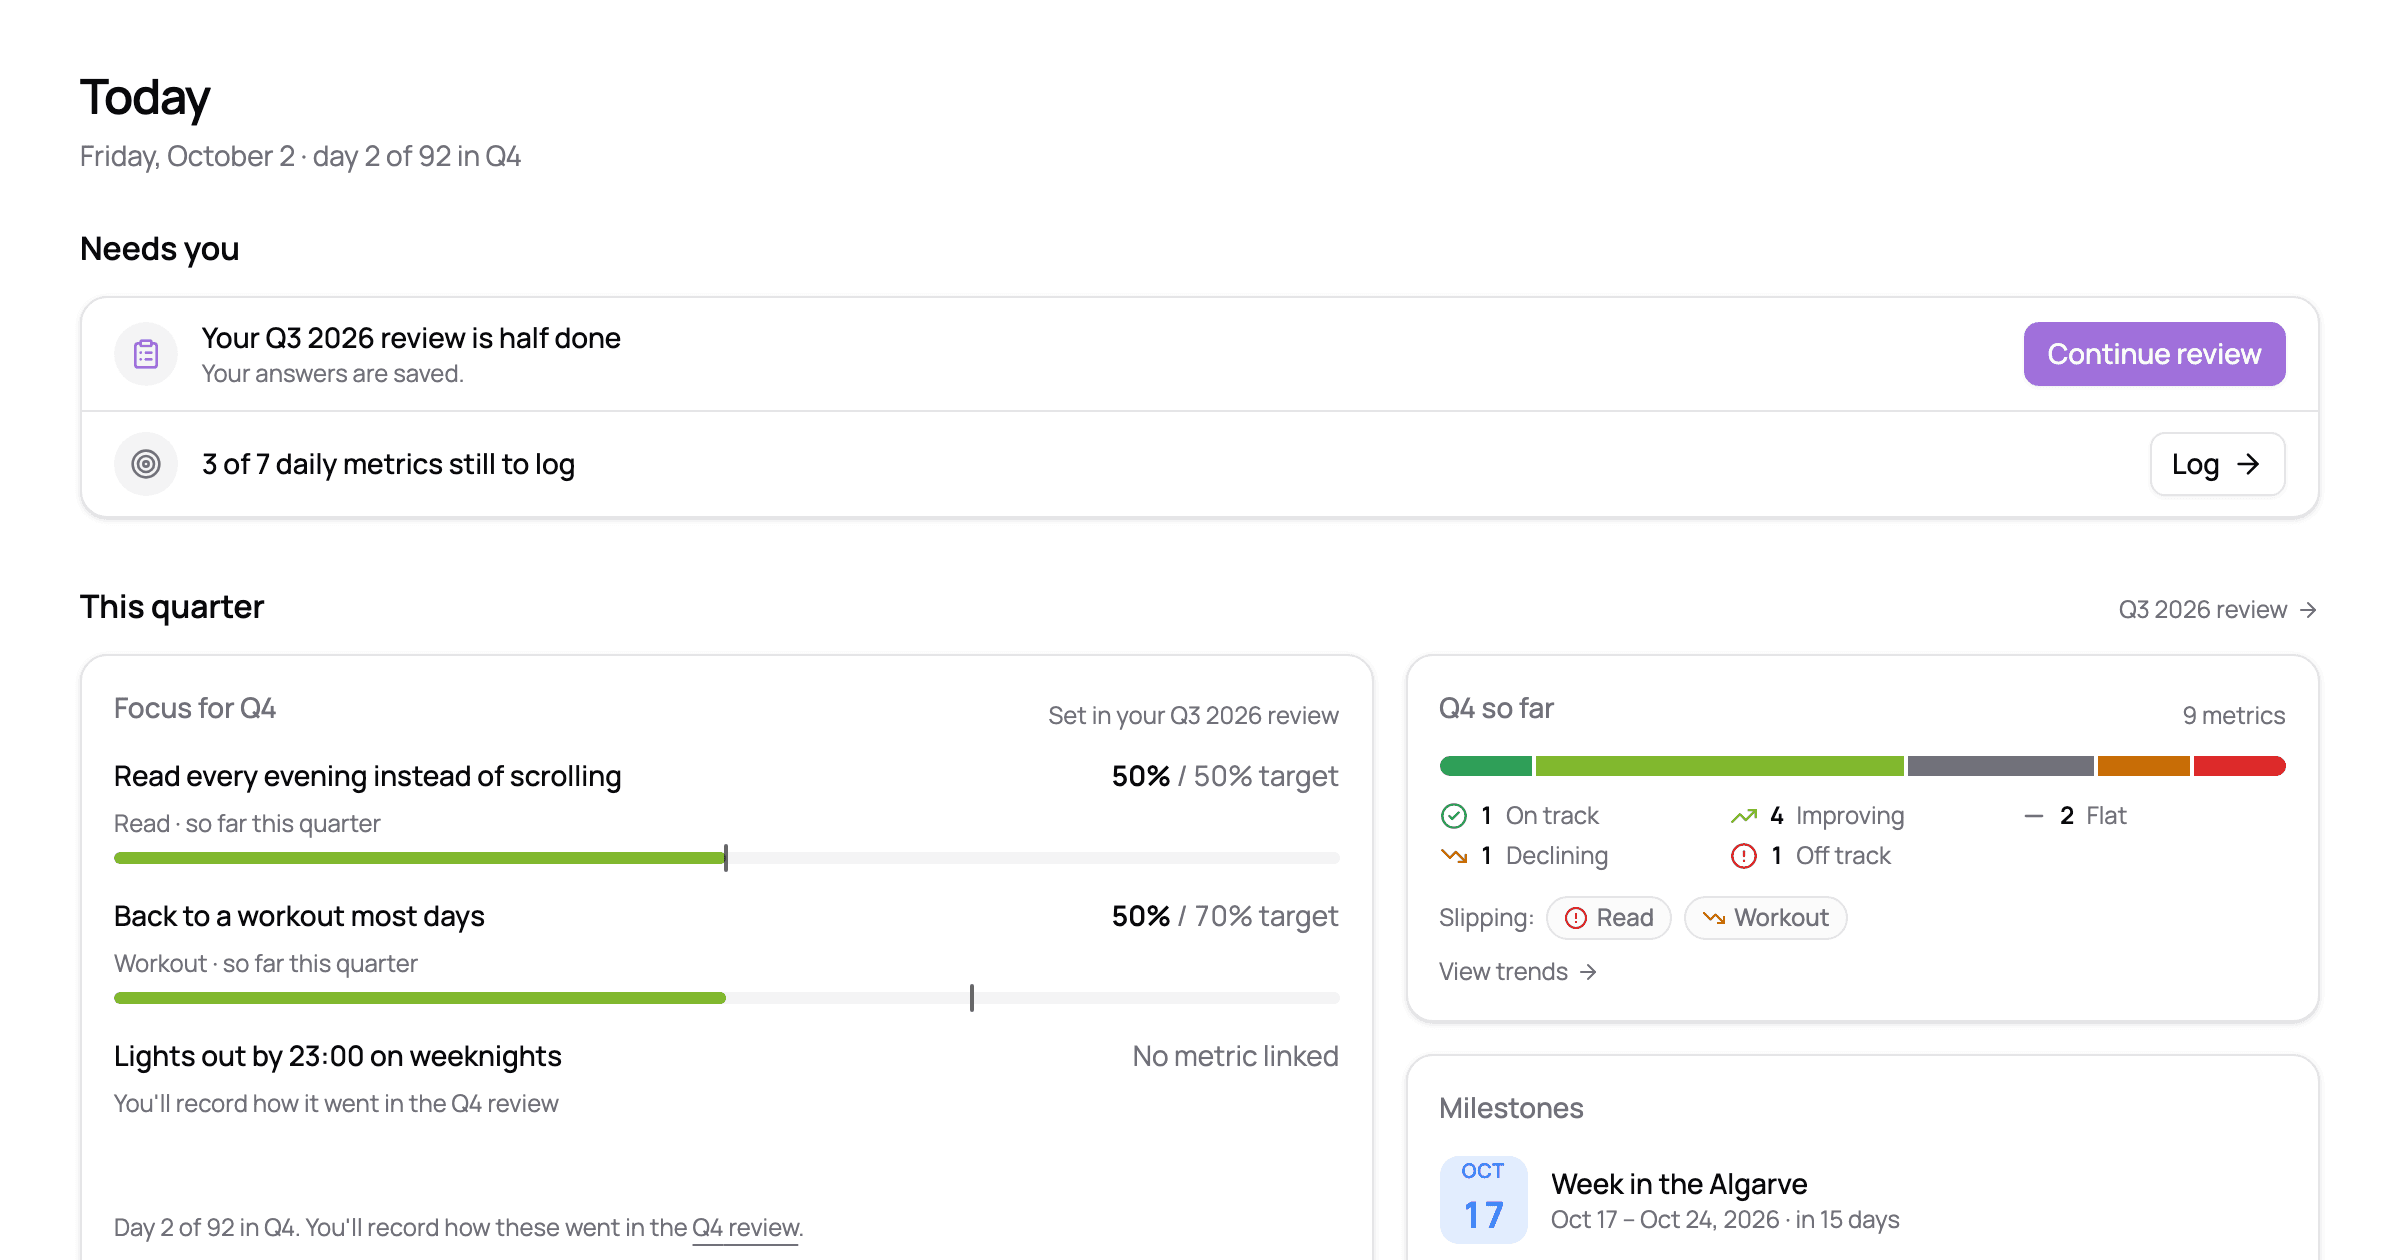
If you came here for a list, here's one, with the reason each metric qualifies. These are the metrics on the example account I use for the pictures on this blog. They're close to my own, and they're meant as shapes to copy, not a set to adopt.
- Health: Sleep 7h+, daily, because it explains the rest. Workout, a few times a week, not daily. Meditate, daily, read as a rate.
- Family: Family dinner, most evenings. Call parents, once a week: the kind of thing that only slips when nobody's counting.
- Work: Deep work, two hours a day, a number rather than a tick, because the hours are the point. Out by 6pm, most days.
- Money: Save 15%, once a month, when the bills are in.
- Learning: Read, daily. Twenty minutes before bed is the version that survives.
Nine metrics, five areas, none that need a judgement call, none that depend on someone else, and each with a frequency that matches the thing. If your picture of a good day has friends, faith, a garden or an instrument in it, swap an area; the shapes still apply. The step before this list, going from your own picture of a good day to your own areas, is in the life planning post.
How to tell which is which: three questions, once a quarter
A metric earns its place by surviving the quarterly check, and I ask three questions of each one. The full review is in how to do a quarterly life review in 60 minutes; this is the part about the list itself.
- Did I log it? A metric that's blank most days isn't a metric, it's a reminder of something I meant to do. Either the frequency is wrong, or logging it is a chore, or I don't care about it as much as I thought. All three are good to know.
- Did the number tell me anything? If it's been 100% for three quarters, it's a habit now, and it doesn't need a line in the Log. If it swings around with no story behind it, it's probably a judgement call in disguise.
- Did it move with my life, or against it? The sleep metric went down when the baby came, and that was the right reading. A metric that makes a good decision look like a failure is hurting, however honest the number.
Then one of four things happens. Most metrics stay. Some get a new target: Out by 6pm at three days instead of four for a busy quarter. Some get paused, like exercise in the months after a birth, with their history kept for when life has room again. And a few get dropped, because they were borrowed, or doubled another, or never produced a number I acted on. None of those is a failure. The list is there to describe the life you're living, and it should change when the life does.
If you'd rather not keep the spreadsheet
I kept all of this in a Google Sheet for years, columns added and quietly abandoned, and it works if you like spreadsheets.
Good Work is that sheet turned into an app, built around the idea that the list will change. You define your own metrics, each with a target and a frequency. When one stops helping you pause it, adjust its target, or drop it, and your history stays as it was. All of that is on the free plan. The quarterly and yearly Trends reports, which put each metric next to the period before and are where I ask the three questions above, are part of Premium, which includes a 30-day trial. There's more on how it fits together on the life tracking app page.
Start with a handful from your own picture of a good day, give each a frequency that fits, and ask the three questions when the quarter ends. Log what you can.
→ Build your dashboard, free — free plan, no credit card.
Thanks for reading, Henrique